
 Guest Author
By Mishelle Leverne
Research contributor · Fliar Business Intelligence
Research prepared exclusively for Pet Care Story
Cost dominates what owners search for. Research papers and news coverage point elsewhere.
Across eight everyday pet-care worries, cost and insurance take 48.8% of the measured monthly US search volume, but only 2.6% of the dog and cat research papers published between 2017 and 2025 (280 papers, of which 12 are randomized trials or systematic reviews). Food and diet go the other way. They draw 7.4% of searches, 10.0% of papers and 42.5% of the topic mentions in pet-care news. This article describes where attention goes and what kind of research exists behind each worry. It does not give veterinary advice, and nothing in it should be read as treatment guidance.
What we measured
About 95 million US households own a pet, according to the 2025 National Pet Owners Survey reported by the American Pet Products Association (APPA, 2026). We asked what their owners look up, what the news covers and what research papers study. We used three signals:
- Searches. Modelled average monthly US search volumes for 71 pet-worry queries that returned a measured volume (75 were tried), and weekly US search interest from October 2021 to October 2026 for five groups of queries.
- News and blog articles. A pool of pet-care articles in two equal windows, 1 June 2024 to 31 May 2025 and 1 June 2025 to 31 May 2026: 3,655 articles in the earlier window and 3,143 in the recent one.
- Research papers. Papers from 2017 to 2025 indexed as being about dogs or cats, sorted into eight worry topics by words in the title, with study design taken from publication-type labels.
The eight topics are cost and insurance, food and diet, poisons and toxins, parasites and vaccines, symptoms and illness, behavior and anxiety, ageing and end of life, and weight and dental health. Heat and weather were measured in searches and news but dropped from the research comparison because the title words were too loose. A paper counted as a randomized trial is a trial design, not a result. We count designs to see where the strongest kind of testing exists, not to say what works.
Finding 1: cost leads what owners search for
Of the 71 queries, the single largest is “emergency vet near me”, at 450,000 searches a month, 21.7% of the 2,076,190 monthly searches across the eight topics (the 71 queries also include 11,430 searches on heat and weather, which are left out of the topic totals). Pet insurance follows at 246,000, then “pet insurance for dogs” at 165,000. Together the ten cost and insurance queries total 1,013,680 a month, 48.8% of the eight-topic total and 53.7% of the 27 largest queries (the top 25, plus two that tie at the cut-off).
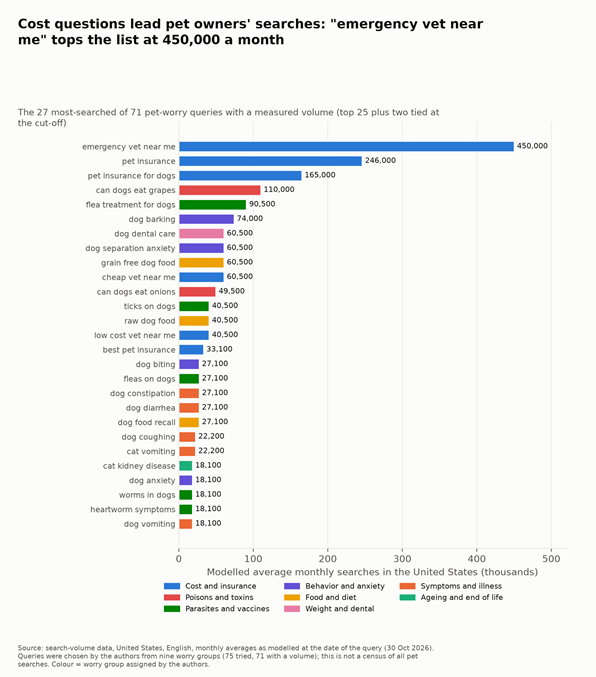
Chart 1. The most-searched pet-worry queries in the United States, modelled monthly volume.
Two things sit inside that cost total. Searches for a nearby vet at emergency, cheap or low-cost level add up to 551,000 a month. Insurance queries add 459,400. Searches that put a price in words are tiny: “how much does a vet visit cost” has 2,400 and “vet bills” 880. People search for where to go and what cover to buy more than for a price. Some of the insurance volume will be shoppers comparing products rather than worried owners, so cost is a mix of worry and purchase.
The largest non-cost query is “can dogs eat grapes” (110,000), followed by “flea treatment for dogs” (90,500), “dog barking” (74,000) and “dog separation anxiety” (60,500). Two national surveys describe the same pressure from the other side. The PetSmart Charities and Gallup study of 2,498 dog and cat owners, fielded from November 2024 to January 2025, found that 52% had skipped or declined needed veterinary care in the past year, and 71% of those cited cost (Hrynowski and Lall, 2025). In a later survey of 933 practising veterinarians, 94% said clients’ finances often (38%) or sometimes (56%) limit the care they can recommend (Kemp, 2026).
Finding 2: searches, news and research are not looking at the same things
We compared the eight topics on three shares, each as a share of that signal’s eight-topic total. Topics overlap, so one article or paper can count under more than one.
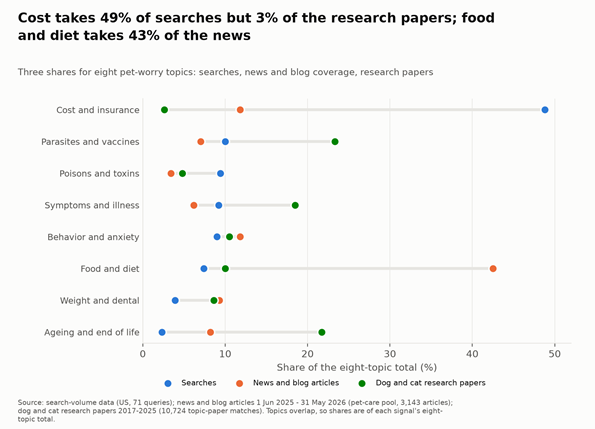
Chart 2. Share of searches, news and blog articles, and dog and cat research papers, by topic.
Cost is the clearest gap: 48.8% of searches, 11.8% of news mentions (186 articles) and 2.6% of papers. Food and diet is the reverse in news, at 42.5% (672 articles), against 7.4% of searches and 10.0% of papers (1,077). Our food phrases include diet, nutrition and recall language, so this is the broadest theme and the most generous count.
Ageing and end of life shows the opposite of cost. It takes 2.3% of searches, 8.2% of news and 21.7% of papers (2,322). Parasites and vaccines hold 23.3% of papers (2,499) against 10.0% of searches. Behavior and anxiety is the closest match across all three, at 9.0%, 11.8% and 10.5%. Poisons and toxins draw 9.4% of searches, 3.4% of news and 4.8% of papers. Cost news also did not follow searches: its share of pet-care coverage was 5.7% in the earlier window and 5.9% in the recent one.
| Topic | Searches a month (modelled) | News and blog articles, 12 months to May 2026 | Research papers, 2017-2025 | Randomized trials and systematic reviews | Share of papers that are trials or reviews |
| Cost and insurance | 1,013,680 | 186 | 280 | 12 | 4.3% |
| Parasites and vaccines | 207,800 | 110 | 2,499 | 103 | 4.1% |
| Poisons and toxins | 195,700 | 53 | 511 | 4 | 0.8% |
| Symptoms and illness | 190,900 | 98 | 1,987 | 128 | 6.4% |
| Behavior and anxiety | 186,570 | 186 | 1,127 | 71 | 6.3% |
| Food and diet | 152,840 | 672 | 1,077 | 101 | 9.4% |
| Weight and dental health | 81,900 | 147 | 921 | 42 | 4.6% |
| Ageing and end of life | 46,800 | 130 | 2,322 | 95 | 4.1% |
Table 1. Eight topics across three signals. Searches a month are the sum of the modelled volumes of the queries we tried in each topic. Search volumes cover the queries we tried, not all pet searches. Topics overlap.
Finding 3: cost searches rose in 2026 and parasites follow the season
For weekly search interest we grouped five queries into each of five groups and tracked them on one scale from October 2021 to October 2026. Cost and insurance sits well above the rest and accounted for 41.2% of the combined index over the last 52 weeks, ahead of illness symptoms (20.4%), behavior and anxiety (18.8%), food recalls and toxic foods (12.4%) and parasites (7.2%).
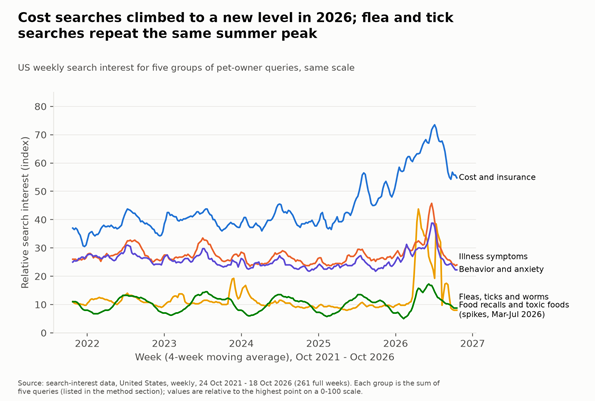
Chart 3. US weekly search interest for five groups of pet-owner queries, same scale.
The cost group averaged 60.4 over the last 52 weeks against 43.4 in the 52 weeks before, up 39%; the year before that it rose 9%. Illness symptoms (+16%), behavior and anxiety (+17%) and parasites (+9%) rose less. The cost, illness and behavior groups all reached their highest week of the five years in the week of 21 June 2026. Illness averaged 45.0 across 24 May to 21 June 2026, against 27.4 in the same weeks of 2025, and behavior 37.4 against 24.4. We found no cause for the shared jump and do not attribute one.
The food group shows +98% on the same test, but that is a spike effect. Eight of the last 52 weeks reached 30 or more, against none in the 52 before (or in any earlier week), and the median week moved only from 9 to 10. The parasite group is the seasonal one. Its monthly average over five years is 13.6 in June against 6.4 in January and February, a 2.1-fold swing, and it repeats each summer.
Finding 4: the South searches for parasites, the Northeast for cost
We compared the five groups inside each state, as shares that sum to 100, over the 12 months to late October 2026.
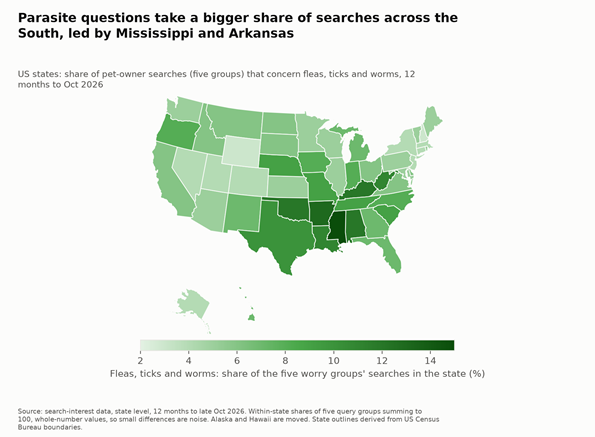
Map. Share of each state’s pet-owner searches (five groups) that concern fleas, ticks and worms.
Parasites take 15% of searches in Mississippi, 13% in Arkansas and 12% in Oklahoma, Alabama and Kentucky, against 3% in New Hampshire, Wyoming and the District of Columbia. Averaged over states, the South stands at 9.2%, the Midwest 6.6%, the West 5.3% and the Northeast 4.3%. The Companion Animal Parasite Council publishes county-level prevalence maps for several parasites, which is the place to check actual occurrence rather than interest (Companion Animal Parasite Council, 2026).
Cost runs the other way. It reaches 50% in New York and Maryland and 47% in Washington, Massachusetts and Connecticut, and falls to 25% in Wyoming, 29% in Mississippi and 30% in Arkansas. Regional averages are 44.3% for the Northeast, 40.2% for the West, 37.6% for the Midwest and 37.5% for the South. Because shares sum to 100, a high parasite share partly pushes the cost share down. Behavior and anxiety peaks in the Midwest and New England: 28% in New Hampshire and 25% in South Dakota. These are shares of search interest, not counts of owners. News about pet owners that the pipeline could place on a map follows population: of 3,865 matched articles in the year to May 2026, 1,658 (42.9%) were placed, and among US states California (185) and Texas (129) led.
Finding 5: where the research design is strongest
Counting the 52,186 dog and cat papers published from 2017 to 2025 that are not letters or comments, 1,547 are randomized trials and 479 are systematic reviews or meta-analyses: 3.9%. Case reports number 4,973, or 9.5%. Within our eight topics the share of trials and reviews runs from 0.8% for poisons and toxins to 9.4% for food and diet.
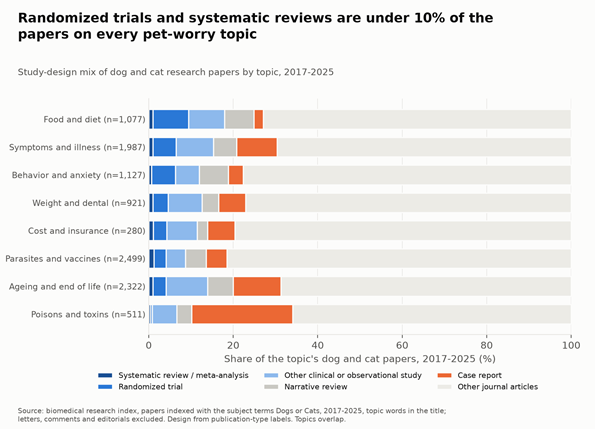
Chart 4. Study-design mix of dog and cat research papers by topic, 2017-2025.
Poisons and toxins is the thinnest. Of 511 papers, 4 are trials or systematic reviews, and 122 (23.9%) are case reports. That is expected, because poisoning trials are not run on pets, but it also means a topic with 9.4% of searches has almost no controlled research to point to. Cost and insurance has 12 trials or reviews in 280 papers. Symptoms and illness has the most trials and reviews (128, 6.4% of its papers), followed by parasites and vaccines (103, 4.1%). Behavior and anxiety has 71 trials or reviews in 1,127 papers, and a 2014 review of separation-related behavior problems described the research on what predisposes dogs to them as equivocal (Sargisson, 2014).
The label “dog and cat paper” includes experimental and colony studies as well as clinical ones, and the US National Library of Medicine defines a veterinary randomized trial as a clinical trial with animal subjects, at least one test treatment and one control treatment (National Library of Medicine, n.d.). A paper count is a count of research effort, not of answers.
What the news is talking about: rising and falling themes
We compared the share of pet-care coverage carrying each of 19 worry themes across the two equal windows. The pool is news and blog articles that mention pet owners, pet parents, pet care, pet health or a vet visit and carry a pet-care or veterinary-medicine label. Each is counted once by opening text. The pool shrank 14.0%, from 3,655 to 3,143, so shares are the fair test. Mentions of “pet owners” across the whole archive fell 24% between July to September 2024 (1,359) and the same quarter of 2025 (1,034).
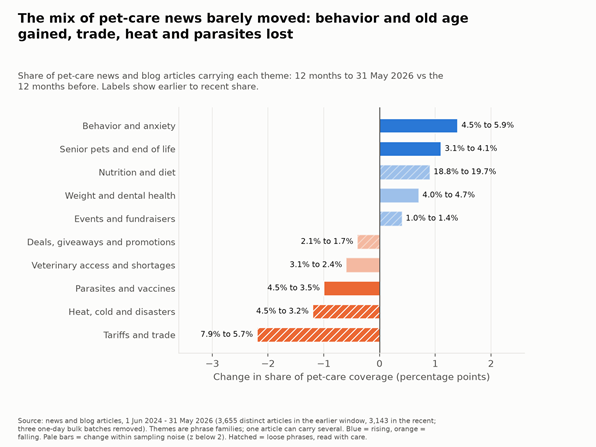
Chart 5. Change in each theme’s share of pet-care coverage, in percentage points. Blue bars are rising themes, orange bars falling.
| Theme | Phrases matched (opening text or tags) | Share, 12 months to May 2025 | Share, 12 months to May 2026 | Change (points) |
| Behavior and anxiety | anxiety, behavior, behaviour, training, barking, aggress, separation | 4.5% | 5.9% | +1.4 |
| Senior pets and end of life | senior, aging, ageing, arthritis, end-of-life, end of life, hospice, euthan, dementia, elderly | 3.1% | 4.1% | +1.1 |
| Nutrition and diet | nutrition, diet, raw food, raw diet, grain-free, grain free, kibble, supplement, ingredient | 18.8% | 19.7% | +0.9 |
| Weight and dental health | obes, overweight, weight loss, dental, teeth, periodontal | 4.0% | 4.7% | +0.7 |
| Events and fundraisers | fundrais, charity, festival, expo, adoption event, walk | 1.0% | 1.4% | +0.4 |
| Deals, giveaways and promotions | deal, discount, sale, coupon, black friday, prime day, giveaway, promo code | 2.1% | 1.7% | -0.4 |
| Veterinary access and shortages | vet shortage, veterinarian shortage, shortage of vet, clinic closure, telehealth, telemedicine, private equity, veterinary clinic, veterinary practice, wait time | 3.1% | 2.4% | -0.6 |
| Parasites and vaccines | flea, tick, heartworm, parasite, vaccin | 4.5% | 3.5% | -1.0 |
| Heat, cold and disasters | heat, hot car, hot weather, cold weather, freezing, winter, storm, hurricane, wildfire, firework, flood | 4.5% | 3.2% | -1.2 |
| Tariffs and trade | tariff, import, supply chain | 7.9% | 5.7% | -2.2 |
Table 2. Five rising and five falling themes among 19 scored, with the phrases that define each.
The honest reading is that the mix barely moved. Only five of the ten changes are larger than sampling noise (a two-proportion test, z of 2 or more): behavior and anxiety and senior pets rose, while parasites and vaccines, heat and cold, and tariffs and trade fell. Behavior and anxiety went from 165 to 186 articles while the pool fell, and senior pets from 112 to 130. Tariffs and trade lost the most, from 7.9% to 5.7% of coverage. Cost and insurance stayed flat at 5.7% and 5.9%, while the search group for cost rose 39%. The weight and dental theme rose 0.7 points, and veterinary access fell 0.6, both within noise.
Three themes are noisy. Nutrition and diet uses broad words such as “ingredient” and “supplement”. Tariffs and trade includes “import”, which matches unrelated text. Heat and cold includes “heat” and “winter”. We also removed three single days from both windows because they held a bulk batch of articles: 14 February 2025 (724 distinct articles on a day where the median is 9), 20 October 2025 (151) and 5 January 2026 (157). With the first of those left in, nutrition and diet appeared to fall 2.5 points, from 23.9% to 21.4%. With it removed the share moves up 0.9. The chart reflects the cleaned pool.
What deserves attention in 2027
We do not forecast, and this is not advice. Reading the signals together, five things stand out.
- Cost and insurance: the largest and fastest-growing search group, with the smallest controlled research base of any topic we measured apart from poisons (12 trials or reviews), and flat news coverage.
- Behavior and anxiety: a rising news theme, large search volume (“dog barking” 74,000 a month) and a research base of 1,127 papers whose predisposing factors are described as equivocal.
- Ageing and end of life: a rising news theme and the largest research base per search, 2,322 papers against 46,800 monthly searches.
- Poisons and toxins: 9.4% of searches, the thinnest trial base and flat news interest.
- Parasites: a predictable seasonal and regional pattern in searches, in a topic where news interest is falling.
Method and limits
Searches (volumes). Modelled average monthly US search volumes for 75 pet-worry queries chosen by the authors from nine worry groups, collected on 30 October 2026. Seventy-one returned a volume. The list is a judgment call, not a census of pet searches, and a different list would give different shares. Volumes are modelled and rounded, and some queries mix worry with shopping (insurance) or local lookup (“near me”). Group labels were assigned by us. Heat and weather (5 queries tried, 11,430 a month in total) is outside the eight-topic comparison.
Searches (weekly interest). US weekly relative search interest, 24 October 2021 to 18 October 2026, 261 full weeks. Each of five groups is the sum of five queries: cost (emergency vet near me, pet insurance, pet insurance for dogs, cheap vet near me, low cost vet near me), food and toxins (can dogs eat grapes, can dogs eat onions, dog food recall, grain free dog food, raw dog food), illness (dog diarrhea, dog vomiting, cat vomiting, dog coughing, dog constipation), parasites (flea treatment for dogs, ticks on dogs, fleas on dogs, worms in dogs, heartworm symptoms) and behavior (dog barking, dog separation anxiety, dog biting, dog anxiety, dog aggression). Values are on a relative scale, not counts. State figures are whole-number shares over the 12 months to late October 2026, so small differences are noise. Regional averages are unweighted means of state shares.
News and blog articles. Articles that mention pet owners, dog or cat owners, pet parents, pet care, pet health, pet insurance, veterinary care, a veterinarian, vet bills or a vet visit and that carry a pet-care or veterinary-medicine label, 1 June 2024 to 31 May 2026, counted once each by opening text. News collection thins after May 2026, so we stopped there. Themes are phrase families listed in Table 2 and applied to opening text or tags. The eight topic counts in Chart 2 use the same approach with the topic phrases. Mentions measure attention, not importance. The place resolution covered 42.9% of the matched articles.
Research papers. Biomedical papers from 2017 to 2025 indexed with the subject terms dogs or cats, with topic words in the title (so papers that discuss a topic without naming it are missed). Letters, comments and editorials were excluded. Design comes from publication-type labels. Topic title words are broad for some topics (for example “cost”, “weight”, “stress”), and a paper can match several topics, so topic counts overlap. We did not read the papers.
Data and analysis. The news, search and research-paper analysis in this article was run with Fliar Prism (Fliar Business Intelligence, 2026a), and the research tools it uses are published as the open-source Prism MCP (Fliar Business Intelligence, 2026b).
Not included. We did not use community discussion data, so owner conversations are represented by searches and news only. The research-paper comparison uses dog and cat papers in the biomedical index (52,186 in 2017 to 2025), not the whole research literature. Search volumes are modelled monthly averages for a chosen query list, not a ranking of every pet search, and the weekly series has no absolute counts. Regional detail comes from search interest by state; the news data could place only 42.9% of articles. We ran no owner survey of our own; the two surveys cited are published Gallup reports. We made no drawings or illustrations beyond the charts, the map and the header image.
References
American Pet Products Association (2026) Industry trends and stats: 2025 National Pet Owners Survey. Available at: https://www.americanpetproducts.org/industry-trends-and-stats (Accessed: 30 October 2026).
Companion Animal Parasite Council (2026) Parasite prevalence maps. Available at: https://capcvet.org/maps/ (Accessed: 30 October 2026).
Fliar Business Intelligence (2026a) Fliar Prism: news, search and research-paper analysis [Data and analysis platform]. Available at: https://fliarbi.com/prism/ (Accessed: 27 October 2026).
Fliar Business Intelligence (2026b) Prism MCP: open-source research tools [Software]. GitHub. Available at: https://github.com/fliarbi/prism-mcp (Accessed: 27 October 2026).
Hrynowski, Z. and Lall, J. (2025) ‘52% of U.S. pet owners skipped or declined veterinary care’, Gallup, 15 April. Available at: https://news.gallup.com/poll/659057/pet-owners-skipped-declined-veterinary-care.aspx (Accessed: 30 October 2026).
Kemp, A. (2026) ‘Veterinarians say cost is the main driver of declined care’, Gallup, 19 January. Available at: https://news.gallup.com/poll/700115/veterinarians-say-cost-main-driver-declined-care.aspx (Accessed: 30 October 2026).
National Library of Medicine (n.d.) Publication characteristics (publication types) with scope notes. Available at: https://www.nlm.nih.gov/mesh/pubtypes.html (Accessed: 30 October 2026).
Sargisson, R.J. (2014) ‘Canine separation anxiety: strategies for treatment and management’, Veterinary Medicine: Research and Reports, 5, pp. 143-151. Available at: https://doi.org/10.2147/VMRR.S60424 (Accessed: 30 October 2026).